The following graphs display the data points for two linear correlations.Based on the information provided in these graphs,______ displays a negative correlation and ______ displays a stronger correlation.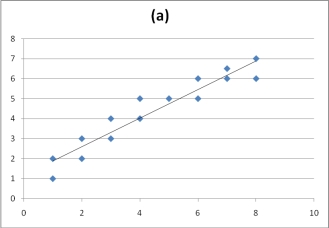
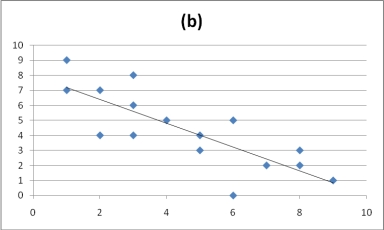
A) Graph A, Graph B
B) Graph B, Graph A
C) Graph A, Graph A
D) Graph B, Graph B
Correct Answer:
Verified
Q1: The coefficient of determination is mathematically
Q2: A statistical procedure used to describe the
Q3: The coefficient of determination is _.
A)
Q4: A researcher measures the following correlation between
Q5: The denominator of the correlation coefficient measures
Q7: The correlation coefficient ranges between _
Q8: A researcher measures the following correlation: r
Q9: A researcher measures the following correlation between
Q10: The correlation coefficient ranges from -1.0 to
Q11: The numerator of the correlation coefficient measures
Unlock this Answer For Free Now!
View this answer and more for free by performing one of the following actions

Scan the QR code to install the App and get 2 free unlocks

Unlock quizzes for free by uploading documents