The graph below depicts the amount of energy involved over the course of a chemical reaction. 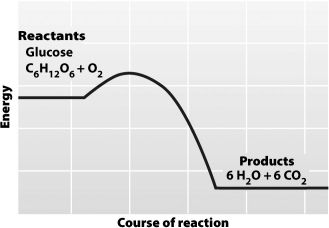
The graph indicates that
A) the products of this reaction have more energy than the substrates.
B) this reaction requires an input of energy to convert glucose and O₂ to H₂O and CO₂.
C) this reaction can only run in one direction (from left to right on the graph) .
D) this reaction occurs only in the presence of an enzyme.
Correct Answer:
Verified
Q24: Imagine a chemical reaction during which a
Q25: What do catalysts and enzymes have in
Q26: A decrease in potential energy between reactants
Q27: In a human cell,
A)one enzyme usually catalyzes
Q28: A molecule of sugar slowly "burns" in
Q30: Heat speeds up chemical reactions by
A)causing the
Q31: Enzymes can catalyze a reaction only if
A)they
Q32: Some kinds of drain cleaners use enzymes
Q33: The metabolism of living organisms consists of
Q34: The heat given off by living systems
Unlock this Answer For Free Now!
View this answer and more for free by performing one of the following actions

Scan the QR code to install the App and get 2 free unlocks

Unlock quizzes for free by uploading documents