Examine the graph below. 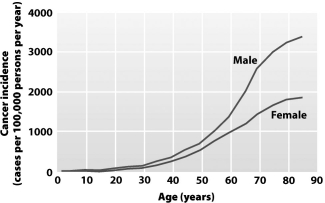
This graph shows that the
A) rate of cancer diagnosis increases for both genders with increasing age.
B) mortality rate for cancer increases more rapidly in older men than in older women.
C) probability of acquiring cancer for both genders becomes greater than 50 percent after age 80.
D) majority of individuals living to age 80 or beyond will be diagnosed with cancer.
Correct Answer:
Verified
Q44: Under normal conditions,growth factors activate _ and
Q55: Although expensive, many health experts are in
Q56: Which of the following statements about viruses
Q57: Malignant cancers often require that a single
Q58: Even though all people are exposed to
Q58: Grilling meat appears to be associated with
Q60: A pesticide was found to cause cancer
Q62: Since the controversy involving stem cells recovered
Q63: Cancer-causing genes are known as _.
Q65: Cancer-causing chemicals increase the risk of cancer
Unlock this Answer For Free Now!
View this answer and more for free by performing one of the following actions

Scan the QR code to install the App and get 2 free unlocks

Unlock quizzes for free by uploading documents