Multiple Choice
The graph below shows the growth of a Paramecium population. 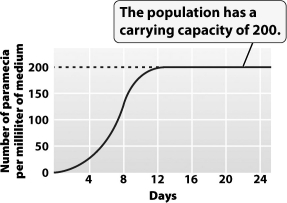
The greatest amount of daily growth occurred when the population was at approximately _____ percent of its carrying capacity
A) 10
B) 25
C) 50
D) 100
Correct Answer:
Verified
Related Questions
Q14: A population will remain at a constant
Q18: The definition of an area, relative to
Q19: One herd of elephants (Herd A)has 100
Q21: The figure below shows that the human
Q23: For most populations,irregular fluctuations in size or
Q24: Studies of the population-size cycles seen between
Unlock this Answer For Free Now!
View this answer and more for free by performing one of the following actions

Scan the QR code to install the App and get 2 free unlocks

Unlock quizzes for free by uploading documents