The figure below shows that the human population was small and relatively stable for nearly 12,000 years, but has increased dramatically in the past 200 years. 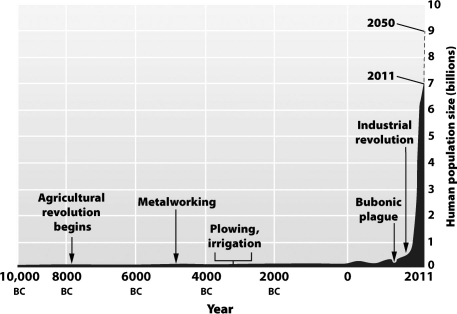
How might this increase in population growth be explained?
A) Disease prevented any significant growth of the human population.
B) For most of human history people were too malnourished to have children.
C) People simply chose to have fewer children in the past than at present.
D) Prior human populations were at existing carrying capacities but newly developed technologies have raised the carrying capacity and permitted the recent expansion.
Correct Answer:
Verified
Q13: The size of a population can be
Q14: A population will remain at a constant
Q15: A population of 100 individuals is undergoing
Q18: The definition of an area, relative to
Q19: One herd of elephants (Herd A)has 100
Q23: For most populations,irregular fluctuations in size or
Q23: The graph below shows the growth of
Q24: Studies of the population-size cycles seen between
Q25: Examine the graph below. Q27: Which of the following situations illustrates a![]()
Unlock this Answer For Free Now!
View this answer and more for free by performing one of the following actions

Scan the QR code to install the App and get 2 free unlocks

Unlock quizzes for free by uploading documents