The figure below shows Sue's and Carlos' demand curves for gasoline. It would be useful to find the equation of the demand curves to answer the questions below.
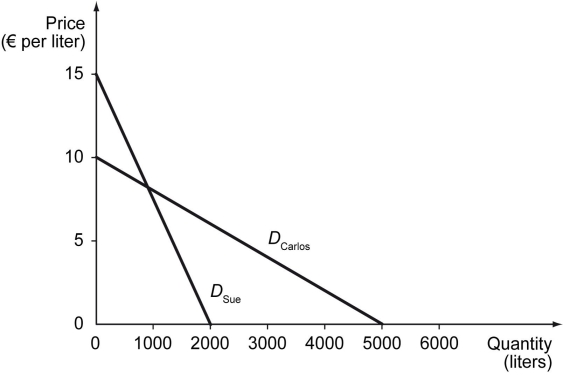
-Refer to the figure above.If the price of gasoline is 12.00 euros per liter,the total quantity of gasoline demanded is ________ liters.
A) 0
B) 400
C) 1,000
D) 1,600
Correct Answer:
Verified
Q41: A change in the quantity demanded of
Q42: The following table shows the demand schedules
Q43: The figure below shows Sue's and Carlos'
Q44: The following table shows the demand schedules
Q45: An increase in the demand for a
Q47: Which of the following pairs of goods
Q48: The following figure shows the demand curves
Q49: The acai berry and products made from
Q50: Two goods are said to be complements
Q51: Las Vegas,Nevada,is a popular vacation destination for
Unlock this Answer For Free Now!
View this answer and more for free by performing one of the following actions

Scan the QR code to install the App and get 2 free unlocks

Unlock quizzes for free by uploading documents