The table below provides supply schedules for small, average, and large soybean growers in Iowa.
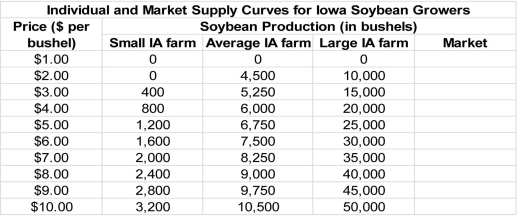
-Refer to the table above.Derive the market quantity supplied at each price and sketch the market supply curve in the graph below.

Correct Answer:
Verified
Q82: The following table shows the supply schedule
Q84: A seller's willingness to accept is the
Q85: Define marginal cost.Is it different from the
Q89: The figure below shows the supply curves
Q90: All else being equal,an increase in the
Q91: Which of the following is the best
Q93: The figure below shows the supply curves
Q95: The following table shows the supply schedule
Q98: The market supply is the _ of
Q99: Based on the derived market quantity supplied,what
Unlock this Answer For Free Now!
View this answer and more for free by performing one of the following actions

Scan the QR code to install the App and get 2 free unlocks

Unlock quizzes for free by uploading documents