The numbers in the table below characterize the market for raccoon skins in Minnesota during the 2010-2011 trapping season. The demand schedule that prevailed in November and December of 2010 is denoted by "Original Quantity Demanded," and the demand schedule that prevailed from late January onward is denoted by "Quantity Demanded-Late January."
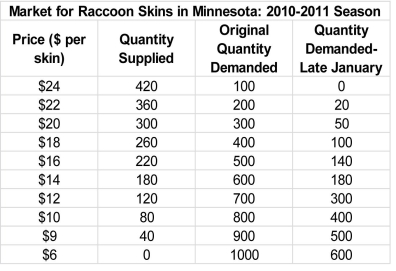
-Refer to the table above.The original equilibrium price is ________ per skin and the original equilibrium quantity is ________ skins.
A) $22; 360
B) $20; 300
C) $16; 500
D) $14; 180
Correct Answer:
Verified
Q134: If there is excess demand in a
Q135: The following table shows the market demand
Q136: The following table shows the market demand
Q137: The following figure shows the demand and
Q138: In a perfectly competitive market,situations of surplus
Q140: The numbers in the table below characterize
Q141: The following figure shows the demand and
Q142: The following figure shows the demand and
Q143: Suppose Z is a normal good.The equilibrium
Q144: The following figure shows the demand and
Unlock this Answer For Free Now!
View this answer and more for free by performing one of the following actions

Scan the QR code to install the App and get 2 free unlocks

Unlock quizzes for free by uploading documents