The following figure shows the demand and supply curves for USB flash drives at different price levels. D is the demand curve, and S₁ is the initial supply curve.
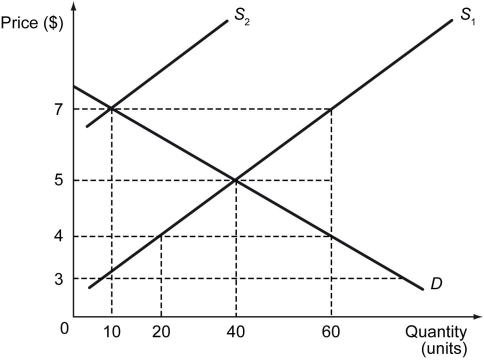
-Refer to the figure above.When the demand curve for flash drives is D and the supply curve of flash drives is S₁,what is the surplus in the market if the price is $7?
A) 10 units
B) 20 units
C) 50 units
D) 60 units
Correct Answer:
Verified
Q155: Suppose Z is a normal good.The equilibrium
Q156: The following figure shows the demand and
Q157: The following figure shows the demand and
Q158: In 2007,an unseasonably dry spring led to
Q159: If the demand for gem-quality diamonds decreases
Q161: A price ceiling imposed by the government
Q162: Refer to the scenario above.If you are
Q163: If the demand and supply curves for
Q164: The table below provides data on opium
Q165: Scenario: Suppose that the government imposes a
Unlock this Answer For Free Now!
View this answer and more for free by performing one of the following actions

Scan the QR code to install the App and get 2 free unlocks

Unlock quizzes for free by uploading documents