The following figure shows the demand and supply curves for USB flash drives at different price levels. D is the demand curve, and S₁ is the initial supply curve.
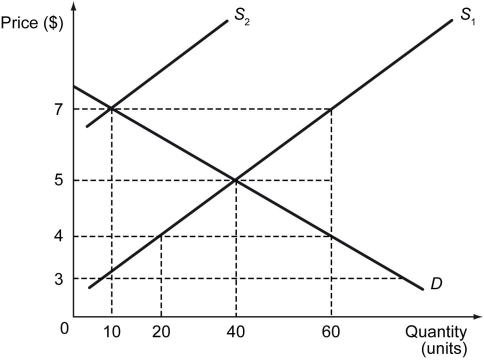
-Refer to the figure above.If the supply curve for flash drives shifts from S₁ to S₂,with no change in the demand curve,the new competitive equilibrium price is ________.
A) $3
B) $4
C) $5
D) $7
Correct Answer:
Verified
Q152: The following figure shows the demand and
Q153: Other things remaining same,a rightward shift in
Q154: The following figure shows the demand and
Q155: Suppose Z is a normal good.The equilibrium
Q156: The following figure shows the demand and
Q158: In 2007,an unseasonably dry spring led to
Q159: If the demand for gem-quality diamonds decreases
Q160: The following figure shows the demand and
Q161: A price ceiling imposed by the government
Q162: Refer to the scenario above.If you are
Unlock this Answer For Free Now!
View this answer and more for free by performing one of the following actions

Scan the QR code to install the App and get 2 free unlocks

Unlock quizzes for free by uploading documents