The following figure shows the demand and supply curves for gas. D₁ is the initial demand curve, and S is the supply curve.
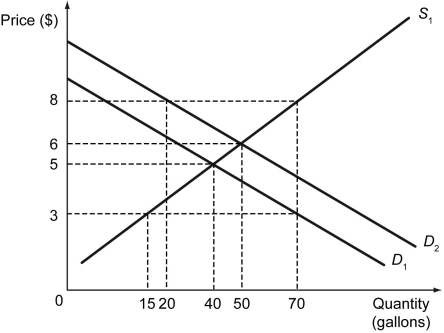
-Refer to the figure above.When the demand curve for gas is D₁ and the supply curve for gas is S,the equilibrium price is ________.
A) $3
B) $5
C) $6
D) $8
Correct Answer:
Verified
Q141: The following figure shows the demand and
Q142: The following figure shows the demand and
Q143: Suppose Z is a normal good.The equilibrium
Q144: The following figure shows the demand and
Q145: The following figure shows the demand and
Q147: Suppose Z is a normal good.The equilibrium
Q148: Other things remaining same,a leftward shift in
Q149: If the demand and supply curves for
Q150: Other things remaining the same,a leftward shift
Q151: Other things remaining the same,a rightward shift
Unlock this Answer For Free Now!
View this answer and more for free by performing one of the following actions

Scan the QR code to install the App and get 2 free unlocks

Unlock quizzes for free by uploading documents