The following figure illustrates the market demand curve for wine.
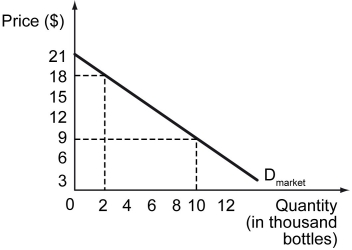
-Refer to the figure above.What is the market-wide consumer surplus when the market price of wine is $9 per bottle?
A) $180,000
B) $90,000
C) $60,000
D) $210,000
Correct Answer:
Verified
Q80: Consumer surplus is _.
A) the difference between
Q81: The following table shows the marginal benefit
Q82: Now suppose the demand curve remains constant
Q83: The following table shows the marginal benefit
Q84: The following figure illustrates the market demand
Q86: The following figure illustrates the market demand
Q87: The following table shows the benefit that
Q88: Which of the following statements correctly differentiates
Q89: a)Define the term "consumer surplus." If your
Q90: Which of the following is the best
Unlock this Answer For Free Now!
View this answer and more for free by performing one of the following actions

Scan the QR code to install the App and get 2 free unlocks

Unlock quizzes for free by uploading documents