The following figure illustrates the market demand curve for solar-powered lights.
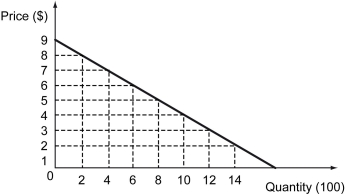
-Refer to the figure above.What is the absolute value of the arc elasticity of demand for solar-powered lights when their price falls from $8 to $4?
A) 2
B) 4
C) 8
D) 10
Correct Answer:
Verified
Q97: The following figure illustrates the market demand
Q98: The following table shows the benefit that
Q99: The following figure shows the market demand
Q100: The weekly quantity demanded of frozen pizzas
Q101: The demand curves for good A and
Q103: Sofia is selling homemade cakes.The demand for
Q104: Scenario: When the price of wine is
Q105: The following figure illustrates the market demand
Q106: Which of the following formulas is used
Q107: When the price of milk is $3
Unlock this Answer For Free Now!
View this answer and more for free by performing one of the following actions

Scan the QR code to install the App and get 2 free unlocks

Unlock quizzes for free by uploading documents