The following figure shows the indifference curves (IC) and the budget constraint (BC) of a consumer who needs to decide between the number of trousers and shirts he should purchase.
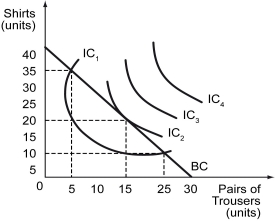
-Refer to the figure above.Which indifference curve depicts the highest level of utility?
A) IC₁
B) IC₂
C) IC₃
D) IC₄
Correct Answer:
Verified
Q174: _ is a measure of the satisfaction
Q175: For any two indifference curves,the one on
Q176: The following figure shows the indifference curves
Q177: From a firm's point of view,when the
Q178: For a given level of total utility,_.
A)
Q180: Suppose the demand for Big Macs at
Q181: In a set of indifference curves,why do
Q182: The substitution effect of a price change
Q183: Define the following terms:
a)Indifference curve
b)Utility
Q184: Using an example of a bundle of
Unlock this Answer For Free Now!
View this answer and more for free by performing one of the following actions

Scan the QR code to install the App and get 2 free unlocks

Unlock quizzes for free by uploading documents