The following graph shows the supply curve of a product.What is the arc price elasticity of supply of this product when its price changes from $12 to $8?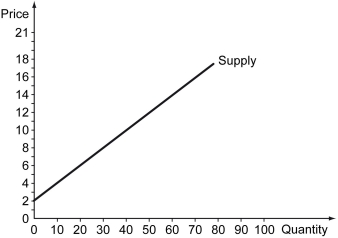
A) 1
B) 1.25
C) 0.50
D) 0.75
Correct Answer:
Verified
Q117: The equilibrium price of a good sold
Q118: The marginal cost curve intersects _.
A) the
Q119: The output of a bakery is 250
Q120: The total revenue earned from the sale
Q121: The figure below shows cost curves of
Q123: If a firm's supply curve is linear
Q124: The figure below shows the cost curves
Q125: When the price of a good increases
Q126: A supply curve shows the relationship between
Q127: The price elasticity of supply is the
Unlock this Answer For Free Now!
View this answer and more for free by performing one of the following actions

Scan the QR code to install the App and get 2 free unlocks

Unlock quizzes for free by uploading documents