The figure below shows the supply and the demand for a good (left) and the cost curves of an individual firm in this market (right) . Assume that all firms in this market, including the potential entrants, have identical cost curves. Initially, the market is in equilibrium at point A.
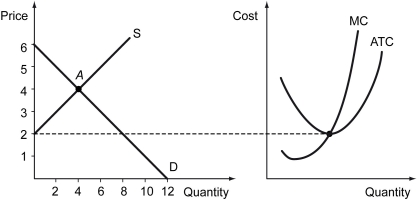
-Refer to the figure above.As firms enter or exit,the market will tend toward the long-run equilibrium,where each firm earns ________ at the price ________.
A) positive economic profit; $3
B) negative economic profit; $2
C) zero economic profit; $2
D) zero accounting profit; $0
Correct Answer:
Verified
Q249: The figure below shows the supply and
Q250: A _ is a payment or a
Q251: Which of the following statements is true?
A)
Q252: Scenario: The figure below shows the supply
Q253: Which of the following statements is true
Q255: Scenario: The figure below shows the supply
Q256: Suppose ethanol is produced in a perfectly
Q257: The figure below shows the supply and
Q258: In a competitive industry where different firms
Q259: Which of the following statements is true
Unlock this Answer For Free Now!
View this answer and more for free by performing one of the following actions

Scan the QR code to install the App and get 2 free unlocks

Unlock quizzes for free by uploading documents