The following graph represents the market for a certain good.
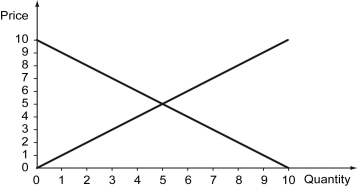
-Refer to the graph above.Which of the following is true?
A) Social surplus could be increased if the producer could manage to sell more than five units at the price of 5.
B) Selling a sixth unit at a price of 5 increases social surplus by 1.
C) As long as the price of the good is 5, social surplus is maximized independently of the quantity sold.
D) As long as the quantity sold is 5, social surplus is maximized independently of the price of the good.
Correct Answer:
Verified
Q75: When an outcome is Pareto efficient,_.
A) social
Q76: Which of the following statements is true
Q77: $20 is to be divided among two
Q78: Which of the following is true of
Q79: Which of the following statements is true
Q81: Scenario: There are two firms producing ballpoint
Q82: Scenario: The scenario above changes, because an
Q83: If a firm faces an average total
Q84: Scenario: A small firm manufactures maple baseball
Q85: The following figure shows the marginal cost
Unlock this Answer For Free Now!
View this answer and more for free by performing one of the following actions

Scan the QR code to install the App and get 2 free unlocks

Unlock quizzes for free by uploading documents