The following figure shows the marginal cost curves of two profit-maximizing firms-Firm A and Firm B-in a perfectly competitive market.
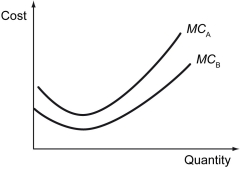
-Refer to the figure above.Which of the following statements is true?
A) Firm B produces at a higher marginal cost than Firm A.
B) At a given market price, Firm A will enjoy a greater producer surplus.
C) Firm A will have a higher reservation value for the good than Firm B.
D) Firm B will produce a lower quantity than Firm A at all prices.
Correct Answer:
Verified
Q60: The following figure illustrates the demand and
Q61: The following graph shows the marginal cost
Q62: Take a deck of playing cards and
Q63: If firms in a competitive industry independently
Q64: The following figure shows the marginal cost
Q66: $100 is to be divided among two
Q67: Efficiency in competitive markets is characterized by
Q68: The following graph represents the market for
Q69: The following graph represents the market for
Q70: Define a Pareto efficient outcome.Does it ensure
Unlock this Answer For Free Now!
View this answer and more for free by performing one of the following actions

Scan the QR code to install the App and get 2 free unlocks

Unlock quizzes for free by uploading documents