The following figure shows the marginal cost curve and the average total cost curve of a firm operating in a perfectly competitive industry.
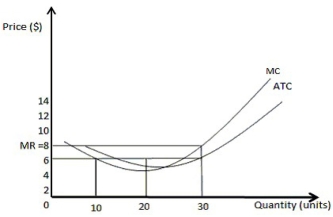
-Refer to the figure above.At what level of output does the firm maximize profits?
A) 0 units
B) 10 units
C) 20 units
D) 30 units
Correct Answer:
Verified
Q84: Scenario: A small firm manufactures maple baseball
Q85: The following figure shows the marginal cost
Q86: Scenario: A small firm manufactures maple baseball
Q87: The following figure shows the marginal cost
Q88: Scenario: A small firm manufactures maple baseball
Q90: The following figure shows the marginal cost
Q91: The following figure shows the marginal cost
Q92: Scenario: A small firm manufactures maple baseball
Q93: Scenario: The scenario above changes, because an
Q94: The following figure shows the marginal cost
Unlock this Answer For Free Now!
View this answer and more for free by performing one of the following actions

Scan the QR code to install the App and get 2 free unlocks

Unlock quizzes for free by uploading documents