The following figure shows the marginal cost curve and the average total cost curve of a firm operating in a perfectly competitive industry.
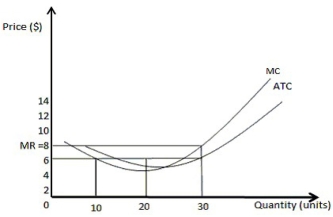
-Refer to the figure above.Which of the following statements is true?
A) The firm maximizes profits if it produces 10 units of the good.
B) If the market price is $10, the firm will suffer losses.
C) If the market price is $2, the firm will make profits.
D) The firm makes maximum profits if it produces 30 units.
Correct Answer:
Verified
Q93: Scenario: The scenario above changes, because an
Q94: The following figure shows the marginal cost
Q95: The following figure shows the marginal cost
Q96: If price is greater than the average
Q97: The following figure shows the marginal cost
Q99: The following figure shows the marginal cost
Q100: When two firms in a perfectly competitive
Q101: Scenario: A manufacturing firm operates three plants
Q102: The following figure depicts the short-run cost
Q103: Scenario: There are two firms producing ballpoint
Unlock this Answer For Free Now!
View this answer and more for free by performing one of the following actions

Scan the QR code to install the App and get 2 free unlocks

Unlock quizzes for free by uploading documents