The following figure illustrates the marginal cost (MC)curves of two firms operating in the same industry.The marginal cost of Firm B is higher than the marginal cost of Firm A.
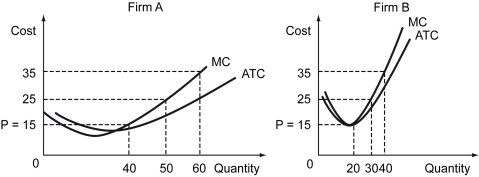
a)What is the optimal output of each firm if the market price is $15?
b)The government decides to shut down Firm B,as it has a higher marginal cost than Firm A.If it does so and asks Firm A to produce the combined output of firms A and B,will production be efficient? Explain your answer.
c)How does the invisible hand work in such an industry?
Correct Answer:
Verified
View Answer
Unlock this answer now
Get Access to more Verified Answers free of charge
Q113: Scenario: There are two firms producing ballpoint
Q114: The following figure depicts the short-run cost
Q115: Scenario: A manufacturing firm operates three plants
Q116: The following figure depicts the short-run cost
Q117: Positive economic profits in a perfectly competitive
Q119: The following figure depicts the short-run cost
Q120: Scenario: A manufacturing firm operates three plants
Q121: The following figure represents the cost curves
Q122: The incentive for new firms to enter
Q123: When sellers in a perfectly competitive market
Unlock this Answer For Free Now!
View this answer and more for free by performing one of the following actions

Scan the QR code to install the App and get 2 free unlocks

Unlock quizzes for free by uploading documents