The following figure shows the marginal cost curve and the average total cost curve of a firm operating in a perfectly competitive market. All of the other firms in this market have a cost structure similar to this firm's.
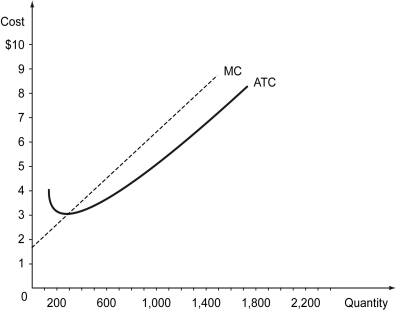
-Refer to the figure above.Suppose the price in this market is $5.We expect ________.
A) the firms to start exiting this market
B) the firms to start entering this market
C) no entry or exit in this market
D) exit from this market, followed by entry of firms into this market
Correct Answer:
Verified
Q142: What is likely to happen to the
Q143: Scenario: The rare earth element neodymium is
Q144: The following figure shows the marginal cost
Q145: A firm owns two production plants. The
Q146: Suppose the firms in a perfectly competitive
Q148: The invisible hand is mostly guided by
Q149: Which of the following statements is true
Q150: How do perfectly competitive markets allow for
Q151: The following figure shows the marginal cost
Q152: If exit occurs from the U.S.coal industry
Unlock this Answer For Free Now!
View this answer and more for free by performing one of the following actions

Scan the QR code to install the App and get 2 free unlocks

Unlock quizzes for free by uploading documents