The following figure illustrates the demand and supply curves for a good.
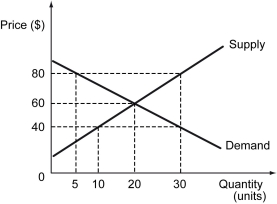
-Refer to the figure above.Which of the following is likely to happen if a price control of $80 is imposed in the market?
A) There will be a surplus of 25 units in the market.
B) There will be a shortage of 25 units in the market.
C) There will be a surplus of 10 units in the market.
D) There will be a shortage of 10 units in the market.
Correct Answer:
Verified
Q156: The U.S.coal industry has endured several years
Q157: Without any restrictions in a perfectly competitive
Q158: Scenario: The rare earth element neodymium is
Q159: If a new production process is developed
Q160: Scenario: The rare earth element neodymium is
Q162: The following figure shows the demand and
Q163: The following figure illustrates the demand and
Q164: The following figure illustrates the demand and
Q165: Scenario: The retail market for beef in
Q166: A price control is _.
A) a market-determined
Unlock this Answer For Free Now!
View this answer and more for free by performing one of the following actions

Scan the QR code to install the App and get 2 free unlocks

Unlock quizzes for free by uploading documents