The following figure shows the demand and supply curves for bottled water.
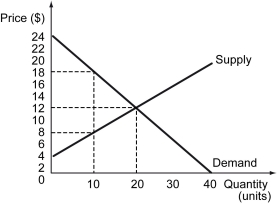
-Refer to the figure above.What is the producer surplus in the market?
A) $20
B) $40
C) $60
D) $80
Correct Answer:
Verified
Q215: The following figure shows the demand and
Q216: D.Gale Johnson was an economist at Iowa
Q217: Which of the following best describes a
Q218: The following figure depicts the market for
Q219: The following figure shows the demand and
Q221: Equity refers to _.
A) Minimizing deadweight loss
B)
Q222: When the maximizing actions of two economic
Q223: The following table displays the reservation values
Q224: Which is NOT a feature of the
Q225: Which of the following is a characteristic
Unlock this Answer For Free Now!
View this answer and more for free by performing one of the following actions

Scan the QR code to install the App and get 2 free unlocks

Unlock quizzes for free by uploading documents