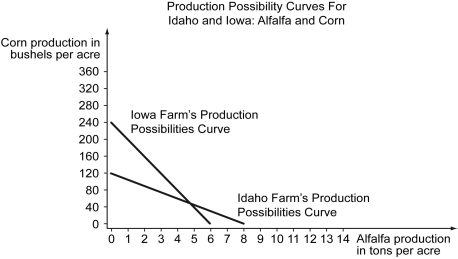
Scenario: The following production possibilities schedules and curves represent the amount of corn and alfalfa that can be produced on an acre of land in Idaho and Iowa.
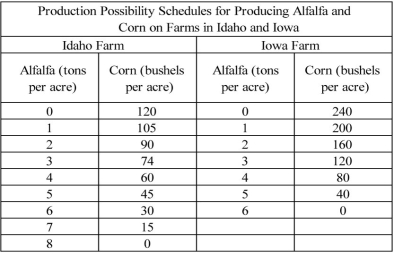
These production possibilities schedules are shown in the following figure.
-Refer to the scenario above.The opportunity cost of a bushel of corn in Iowa is ________.
A)  of a ton of alfalfa
B) 1 ton of alfalfa
C) 6 tons of alfalfa
D) 40 tons of alfalfa
Correct Answer:
Verified
Q23: The following figure depicts a nonlinear production
Q24: If an economy is producing on the
Q25: Scenario: Suppose a country produces only two
Q26: Scenario: Suppose a country produces only two
Q27: How is a production possibilities curve similar
Q29: Even though points inside a production possibilities
Q30: Points inside a production possibilities curve are
Q31: Points on a production possibilities curve are
Q32: The following figure depicts a nonlinear production
Q33: Points inside a production possibilities curve are
Unlock this Answer For Free Now!
View this answer and more for free by performing one of the following actions

Scan the QR code to install the App and get 2 free unlocks

Unlock quizzes for free by uploading documents