The following figure shows the production possibilities curves (PPCs) of two individuals, Ryan and Tom.
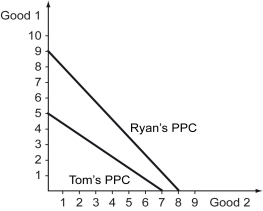
-Refer to the figure above.Which of the following statements is true?
A) Ryan's opportunity cost of producing Good 1 is higher than that of Tom, whereas Tom's opportunity cost of producing Good 2 is higher than that of Ryan.
B) Ryan's opportunity cost of producing Good 2 is higher than Tom's opportunity cost of producing it.
C) Ryan has a comparative disadvantage in the production of both goods.
D) Tom has a comparative disadvantage in the production of both goods.
Correct Answer:
Verified
Q60: Scenario: With her available resources, Wendy can
Q61: In Lithasia,the opportunity cost of producing a
Q62: The following figure depicts the production possibilities
Q63: The following figure depicts the production possibilities
Q64: Scenario: Meryl and Steve are two classmates
Q66: Which of the following statements best describes
Q67: The following figure depicts the production possibilities
Q68: A firm producing calculators and cell phones
Q69: Scenario: Meryl and Steve are two classmates
Q70: Which of the following statements is true?
A)
Unlock this Answer For Free Now!
View this answer and more for free by performing one of the following actions

Scan the QR code to install the App and get 2 free unlocks

Unlock quizzes for free by uploading documents