The figure below shows the potential gains from specialization for farms in Idaho and Iowa.
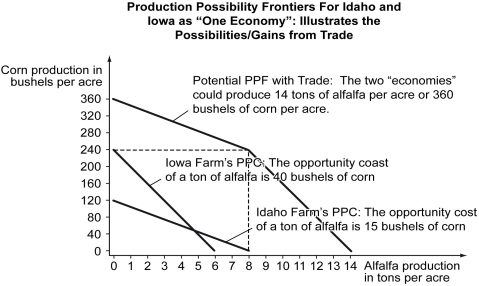
-Refer to the figure above.Under specialization,Idaho produces ________ and Iowa produces ________.
A) 8 tons of alfalfa; 240 bushels of corn
B) 6 tons of alfalfa; 120 bushels of corn
C) 4 tons of alfalfa; 3 tons of alfalfa
D) 60 bushels of corn; 120 bushels of corn
Correct Answer:
Verified
Q95: Scenario: Norway and Sweden each produce cloudberries
Q96: Scenario: Norway and Sweden each produce cloudberries
Q97: What is meant by the term "comparative
Q98: The ability of an individual,firm,or country to
Q99: A(n)_ is any good that is produced
Q101: Which of the following will cause an
Q102: Scenario: Hawaii and South Carolina are trading
Q103: Which of the following statements is true?
A)
Q104: A production possibilities curve is plotted for
Q105: The curvature of an economy's production possibilities
Unlock this Answer For Free Now!
View this answer and more for free by performing one of the following actions

Scan the QR code to install the App and get 2 free unlocks

Unlock quizzes for free by uploading documents