The following figure depicts four different scenarios in which the blue line represents California's production possibilities curve (PPC) and the red line represents Texas' PPC. These two states trade wine and cloth.
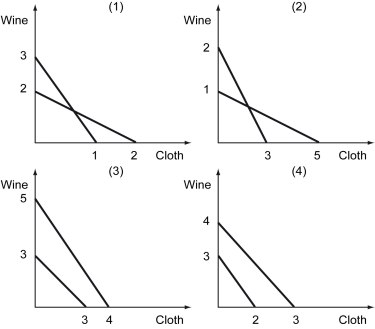
-Refer to the figure above.In what scenario(s) does Texas have a comparative advantage in wine?
A) (1)
B) (2)
C) (2) and (4)
D) (4)
Correct Answer:
Verified
Q124: The following table shows the value of
Q125: The following figure depicts four different scenarios
Q126: The following table shows the value of
Q127: The figures below show markets for solar
Q128: Which of the following statements is true?
A)
Q130: Scenario: Hawaii and South Carolina are trading
Q131: The figures below show markets for solar
Q132: The figures below show markets for solar
Q133: The figures below show markets for solar
Q134: The figures below show markets for solar
Unlock this Answer For Free Now!
View this answer and more for free by performing one of the following actions

Scan the QR code to install the App and get 2 free unlocks

Unlock quizzes for free by uploading documents