The following figure shows the demand curve, D, and the supply curve, S, for calculators in Barylia in four different scenarios. Barylia is open to free trade.
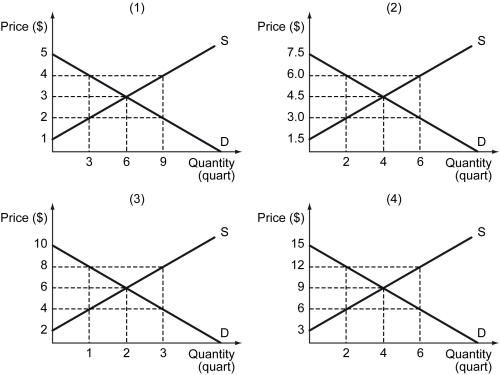
-Refer to the figure above.Let the world price of calculators be $4.In what scenario(s) does Barylia become a net exporter of calculators?
A) (1)
B) (2)
C) (1) and (3)
D) (2) , (3) , and (4)
Correct Answer:
Verified
Q145: The table below shows the domestic price
Q146: The domestic supply and demand of a
Q147: A world price for a good is
Q148: Scenario: Now suppose the United States continues
Q149: The U.S.wheat market is represented by the
Q151: The table below shows the domestic price
Q152: The following figure shows the demand curve,
Q153: The table below shows the domestic price
Q154: Which of the following statements is true?
A)
Q155: Scenario: Now suppose the United States can
Unlock this Answer For Free Now!
View this answer and more for free by performing one of the following actions

Scan the QR code to install the App and get 2 free unlocks

Unlock quizzes for free by uploading documents