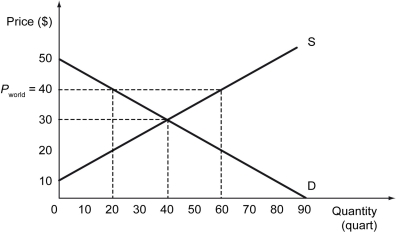
The following figure shows the demand curve, D, and the supply curve, S, for calculators in Barylia. The world price of calculators is $40.

-Refer to the figure above.Which of the following statements is true?
A) Barylia as a whole gained from opening up to free trade.
B) Barylia as a whole lost from opening up to free trade.
C) The buyers of calculators in Barylia gained from opening up to free trade.
D) The firms in Barylia that manufactured calculators lost from opening up to free trade.
Correct Answer:
Verified
Q167: The figure below shows the domestic supply
Q168: The following figure shows the demand curve,
Q169: The following figure shows the demand curve,
Q170: The following figure shows the demand curve,
Q171: The following figure shows the demand curve,
Q173: The following figure shows the demand curve,
Q174: Fair trade products consist of goods that
Q175: The following figure shows the demand curve,
Q176: The following figure shows the demand curve,
Q177: The following figure shows the demand curve,
Unlock this Answer For Free Now!
View this answer and more for free by performing one of the following actions

Scan the QR code to install the App and get 2 free unlocks

Unlock quizzes for free by uploading documents