The following figure shows the market supply and demand of a good whose production entails a $2 negative externality per unit.
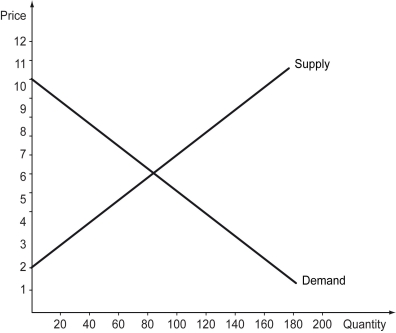
-Refer to the figure above.The socially optimal quantity of this good should be ________ units.
A) 60
B) 70
C) 80
D) 100
Correct Answer:
Verified
Q16: An externality occurs when _.
A) the quantity
Q17: Scenario: In Brazil, more than 60 percent
Q18: The market demand curve for a good
Q19: The following figure shows the private cost
Q20: If negative externalities are present in a
Q22: If positive externalities are present in a
Q23: The following figure shows the market supply
Q24: The following figure shows the market supply
Q25: The drainage of chemical fertilizers used on
Q26: Why does the presence of negative externalities
Unlock this Answer For Free Now!
View this answer and more for free by performing one of the following actions

Scan the QR code to install the App and get 2 free unlocks

Unlock quizzes for free by uploading documents