The consumption of a good entails a $2 positive external benefit per unit.The following graph shows the market supply and demand of this good.Which of the dashed lines represents the marginal social benefit curve?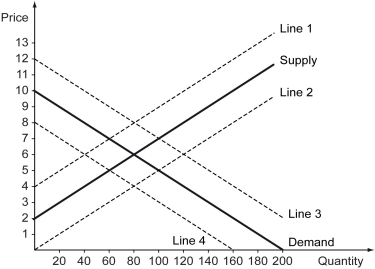
A) Line 1
B) Line 2
C) Line 3
D) Line 4
Correct Answer:
Verified
Q51: The marginal social benefit from the production
Q52: Which of the following activities is most
Q53: The production of a certain fertilizer emits
Q54: The figure below shows the demand, supply,
Q55: The following figure shows the market supply
Q57: The figure below shows the demand, supply,
Q58: Which of the following is most likely
Q59: If too little of a good is
Q60: The figure below shows the demand, supply,
Q61: Cleanliness experts say that cleaning a house
Unlock this Answer For Free Now!
View this answer and more for free by performing one of the following actions

Scan the QR code to install the App and get 2 free unlocks

Unlock quizzes for free by uploading documents