The figure below shows the demand, supply, and marginal social benefit curves for Good Y.
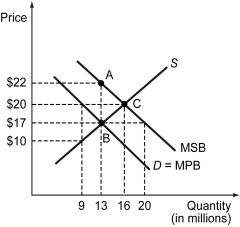
-Refer to the figure above.The triangular region ABC represents the ________.
A) deadweight loss due to the presence of a pecuniary externality
B) deadweight loss due to the presence of a negative externality
C) economic loss of not recognizing a positive externality
D) inefficiency created by not recognizing a negative externality
Correct Answer:
Verified
Q55: The following figure shows the market supply
Q56: The consumption of a good entails a
Q57: The figure below shows the demand, supply,
Q58: Which of the following is most likely
Q59: If too little of a good is
Q61: Cleanliness experts say that cleaning a house
Q62: Scenario: Ron plays loud music, which prevents
Q63: Jack wants to buy a new house.But
Q64: Which of the following is necessary for
Q65: Scenario: The following figure shows the private
Unlock this Answer For Free Now!
View this answer and more for free by performing one of the following actions

Scan the QR code to install the App and get 2 free unlocks

Unlock quizzes for free by uploading documents