The following figure shows the supply and demand curves in a competitive market for a good. The government is considering a $1.50 tax on this good.
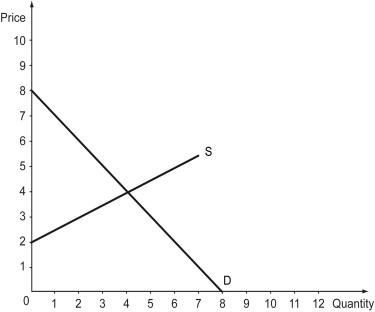
-Refer to the above figure.If the $1.50 tax is collected from the producers of this good,the consumer surplus will be ________.
A) $2.25
B) $3
C) $4.50
D) $5
Correct Answer:
Verified
Q83: The following figure shows the supply and
Q84: The following figure shows the supply and
Q85: The figure below shows the demand (D)
Q86: The imposition of all taxes,except Pigouvian taxes,leads
Q87: Scenario: The market for a particular video
Q89: Explanation: The following figure illustrates the answer.
Q90: Explanation: The following figure shows the result
Q91: The term _ refers to how the
Q92: Differentiate between the average tax rate and
Q93: Explanation: The figure below shows these results.
Unlock this Answer For Free Now!
View this answer and more for free by performing one of the following actions

Scan the QR code to install the App and get 2 free unlocks

Unlock quizzes for free by uploading documents