The figure below shows the demand (D) and supply (S) curves for Good X before and after a tax is imposed on each unit of the good sold.
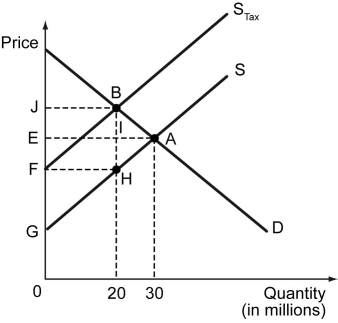
-Refer to the figure above.The region BAH represents the ________.
A) consumer surplus after taxation
B) tax incidence on consumers
C) tax incidence on producers
D) deadweight loss due to taxation
Correct Answer:
Verified
Q96: The following figure shows the supply and
Q97: The following figure shows the supply and
Q98: Explanation: The following figure illustrates the answer.
Q99: If the sellers of a good are
Q100: The following figure shows the supply and
Q102: The figure below shows the demand and
Q103: If a tax is imposed on a
Q104: If a tax is imposed on each
Q105: The figure below shows the demand (D)
Q106: The incidence of a per-unit tax on
Unlock this Answer For Free Now!
View this answer and more for free by performing one of the following actions

Scan the QR code to install the App and get 2 free unlocks

Unlock quizzes for free by uploading documents