The figure below shows the demand and the supply in a market before and after a tax is imposed. The demand and the supply curves are straight lines.
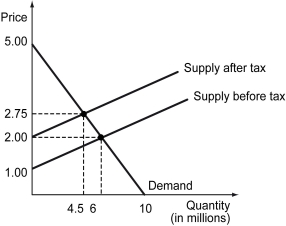
-Refer to the figure above.Who is legally responsible to pay the tax? How much is the tax?
A) Buyers are required to pay the tax of $0.75 per unit bought to the government.
B) Buyers are required to pay the tax of $1.00 per unit bought to the government.
C) Sellers are required to pay the tax of $0.75 per unit sold to the government.
D) Sellers are required to pay the tax of $1.00 per unit sold to the government.
Correct Answer:
Verified
Q108: When the price of laundry detergent is
Q109: If the market supply curve of a
Q110: The tax incidence on buyers is higher
Q111: The figure below shows the demand and
Q112: When does the burden of a tax
Q114: The figure below shows the demand (D)
Q115: The figure below shows the demand (D)
Q116: The figure below shows the demand (D)
Q117: When does the burden of a tax
Q118: The demand curve for pizza in Perilia
Unlock this Answer For Free Now!
View this answer and more for free by performing one of the following actions

Scan the QR code to install the App and get 2 free unlocks

Unlock quizzes for free by uploading documents