The figure below shows the market for Good X:
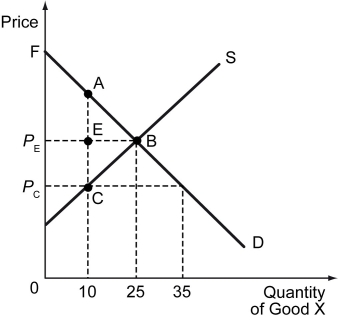
-Refer to the figure above.The region PCCAF shows the ________ after the imposition of the price ceiling.
A) government revenue
B) consumer surplus
C) producer surplus
D) deadweight loss
Correct Answer:
Verified
Q150: The following figure depicts the demand and
Q151: A minimum wage policy is an example
Q152: The figure below shows the market for
Q153: The following figure depicts the demand and
Q154: A price floor is the _.
A) maximum
Q156: The figure below shows the market for
Q157: The figure below shows the market for
Q158: Consider a market with a price floor
Q159: The government of Lithusia has set a
Q160: A gallon of milk costs $4 in
Unlock this Answer For Free Now!
View this answer and more for free by performing one of the following actions

Scan the QR code to install the App and get 2 free unlocks

Unlock quizzes for free by uploading documents