The following figure shows the production function for a perfectly competitive firm.
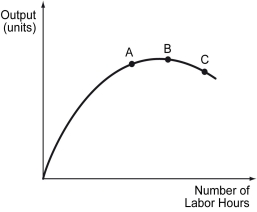
-Refer to the figure above.Which of the following statements is true?
A) The slope of the production function between Points B and C indicates positive returns to labor.
B) The slope of the production function between Points A and B indicates increasing returns to labor.
C) The slope of the production function between Points A and B indicates decreasing returns to labor.
D) The slope of the production function between Points A and C indicates increasing returns to labor.
Correct Answer:
Verified
Q14: The value of the marginal product of
Q15: Scenario: Consider a firm that produces and
Q16: Scenario: Consider a firm that produces and
Q17: Which of the following is NOT an
Q18: Which of the following is an example
Q20: Scenario: Consider a firm that produces and
Q21: Given that the market wage rate is
Q22: The following figure depicts the labor markets
Q23: The negative slope of the labor demand
Q24: The value of the marginal product of
Unlock this Answer For Free Now!
View this answer and more for free by performing one of the following actions

Scan the QR code to install the App and get 2 free unlocks

Unlock quizzes for free by uploading documents