The following table shows the demand and supply of labor in the steel manufacturing industry.
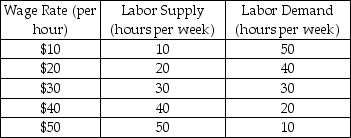
a)What is the equilibrium wage rate and employment level in the industry? Illustrate graphically.
b)If the labor demand shifts to the right,without any change in the labor supply curve,what is likely to happen to the equilibrium wage and the employment level? Explain your answer with the help of a suitable diagram.
c)If the labor supply curve shifts to the left,without any change in the labor demand curve,what is likely to happen to the equilibrium wage and employment level? Explain your answer with the help of a suitable diagram.
Correct Answer:
Verified
View Answer
Unlock this answer now
Get Access to more Verified Answers free of charge
Q88: The following figure depicts the production of
Q89: Scenario: This problem applies the principle of
Q90: The following table shows the hours of
Q91: Which of the following statements is true?
A)
Q92: Which of the following statements is true?
A)
Q94: The following figure depicts the production of
Q95: Scenario: This problem applies the principle of
Q96: Refer to the scenario above.The increase in
Q97: Marnie works at the guest check-in desk
Q98: As the income of an individual increases,she
Unlock this Answer For Free Now!
View this answer and more for free by performing one of the following actions

Scan the QR code to install the App and get 2 free unlocks

Unlock quizzes for free by uploading documents