The figure below shows the demand curve in a monopoly market.
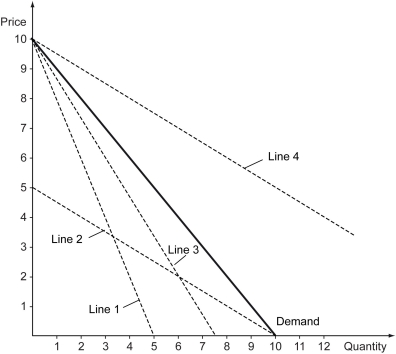
-Refer to the figure above.This monopolist initially produced 6 units,and now has a new plan to produce 8 units of this good.The quantity effect of this plan on the revenue of the monopolist is ________.
A) $3
B) +$6
C) $1
D) +$7
Correct Answer:
Verified
Q85: Scenario: When a monopolist charges $5 for
Q86: Scenario: Mr. Olivander has a monopoly on
Q87: Scenario: Mr. Olivander has a monopoly on
Q88: Scenario: Mr. Olivander has a monopoly on
Q89: The quantity effect of a price decrease
Q91: Over a particular price range,if the quantity
Q92: The following table shows the quantities of
Q93: Scenario: Mr. Olivander has a monopoly on
Q94: Scenario: When a monopolist charges $5 for
Q95: The figure below shows the demand curve
Unlock this Answer For Free Now!
View this answer and more for free by performing one of the following actions

Scan the QR code to install the App and get 2 free unlocks

Unlock quizzes for free by uploading documents