The following table shows the quantities sold of a monopolist's product at different prices.
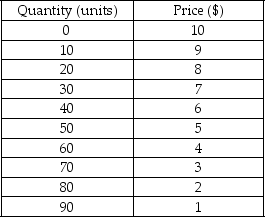
Comment on the relationship between total revenue and marginal revenue from the table.
Correct Answer:
Verified
View Answer
Unlock this answer now
Get Access to more Verified Answers free of charge
Q113: The following figure shows the demand curve
Q114: The following figure shows the demand curve
Q115: Scenario: When a monopolist charges $10 for
Q116: Which of the following is true of
Q117: Scenario: When a monopolist charges $5 for
Q119: Which of the following is true of
Q120: Scenario: When a monopolist charges $10 for
Q121: The total revenue curve of a monopolist
Q122: Scenario: Tobac Co. is a monopolist in
Q123: If a firm can sell 10 units
Unlock this Answer For Free Now!
View this answer and more for free by performing one of the following actions

Scan the QR code to install the App and get 2 free unlocks

Unlock quizzes for free by uploading documents