The following figure shows price versus quantity for a market.
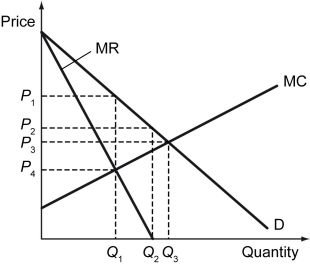
-Refer to the figure above.On what interval of quantity does total revenue decrease when quantity increases?
A) From 0 to Q₂
B) From Q₁ to Q₂
C) From Q₂ to infinity
D) Total revenue never decreases when quantity increases
Correct Answer:
Verified
Q119: Which of the following is true of
Q120: Scenario: When a monopolist charges $10 for
Q121: The total revenue curve of a monopolist
Q122: Scenario: Tobac Co. is a monopolist in
Q123: If a firm can sell 10 units
Q125: A monopolist faces a linear,downward-sloping demand curve.If
Q126: A monopolist faces a linear,downward-sloping demand curve.If
Q127: Scenario: Tobac Co. is a monopolist in
Q128: Scenario: Tobac Co. is a monopolist in
Q129: The total revenue curve of a monopolist
Unlock this Answer For Free Now!
View this answer and more for free by performing one of the following actions

Scan the QR code to install the App and get 2 free unlocks

Unlock quizzes for free by uploading documents