The following figure shows the marginal revenue (MR) and demand curves faced by a monopolist.
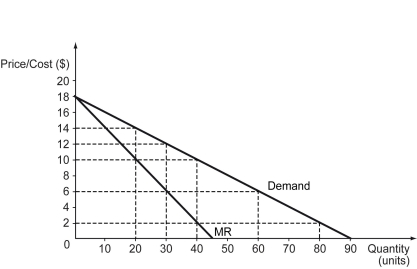
-Refer to the figure above.If the monopolist faces a constant marginal cost of $10,what is the optimal quantity that it should produce?
A) 20 units
B) 30 units
C) 40 units
D) 80 units
Correct Answer:
Verified
Q142: If the marginal revenue of a producer
Q143: The following figure shows the demand and
Q144: At the profit-maximizing level of production of
Q145: Scenario: Mr. Olivander has a monopoly on
Q146: The following table shows the different quantities
Q148: Scenario: Tobac Co. is a monopolist in
Q149: The following figure shows the demand and
Q150: If the marginal cost of a monopolist
Q151: Scenario: Mr. Olivander has a monopoly on
Q152: The following figure shows the marginal revenue
Unlock this Answer For Free Now!
View this answer and more for free by performing one of the following actions

Scan the QR code to install the App and get 2 free unlocks

Unlock quizzes for free by uploading documents