The following figure shows the demand curve and the marginal revenue (MR)curve of a monopolist supplying petroleum.
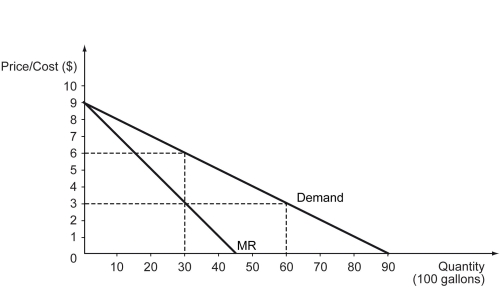
a)If the monopolist faces a constant marginal cost of $3,what is the optimal output that it should produce?
b)If the monopolist faces a constant marginal cost of $3,at what price should it sell the optimal output?
c)If the average total cost of the monopolist is $4 per gallon when it produces the optimal output,determine its profit or loss.
Correct Answer:
Verified
View Answer
Unlock this answer now
Get Access to more Verified Answers free of charge
Q161: The figure below shows the cost and
Q162: The following figure represents the cost and
Q163: The following figure shows the marginal revenue
Q164: The pricing rule for a monopolist who
Q165: The following figure shows the marginal revenue
Q167: A monopolist faces an average total cost
Q168: How does a monopoly decide the optimal
Q169: The following figure shows the marginal revenue
Q170: A profit-maximizing monopolist _.
A) can set any
Q171: The following figure shows the marginal revenue
Unlock this Answer For Free Now!
View this answer and more for free by performing one of the following actions

Scan the QR code to install the App and get 2 free unlocks

Unlock quizzes for free by uploading documents