The following figure shows the graph of a monopoly market. The marginal revenue curve has been omitted.
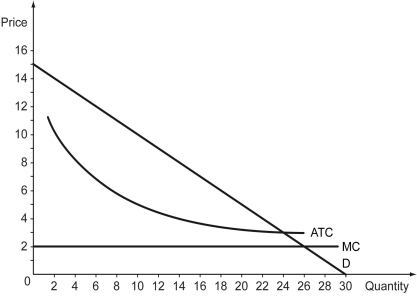
-Refer to the figure above.How much would this monopolist charge for its product?
A) $2
B) $3
C) $5
D) $10
Correct Answer:
Verified
Q178: The following figure shows the marginal revenue
Q179: The following figure represents the cost and
Q180: Which of the following statements correctly differentiates
Q181: Which of the following statements is true
Q184: The supply curve for a monopolist is
Q185: Does a monopolist have a supply curve?
Q186: The following figure shows the revenue and
Q187: Scenario: Suppose the monopolist faces the following
Q188: To maximize profits,the monopolist should charge a
Q196: The figure below shows the cost and
Unlock this Answer For Free Now!
View this answer and more for free by performing one of the following actions

Scan the QR code to install the App and get 2 free unlocks

Unlock quizzes for free by uploading documents