The following figure shows the marginal revenue (MR) curve and the demand curve faced by a monopolist. The monopolist faces a constant marginal cost of $3.
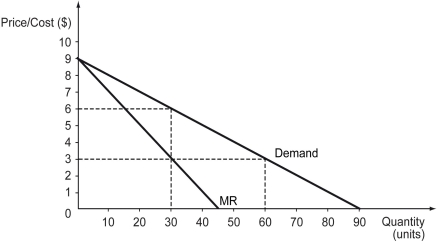
-Refer to the figure above.What is the price at which the monopolist should sell its output?
A) $3
B) $4
C) $6
D) $9
Correct Answer:
Verified
Q172: The figure below shows the cost and
Q187: Scenario: Suppose the monopolist faces the following
Q188: To maximize profits,the monopolist should charge a
Q189: At the profit-maximizing level of output and
Q190: A monopoly produces and sells 300 units
Q191: Which of the following statements is true?
A)
Q193: The following figure shows the marginal revenue
Q195: The following figure shows the revenue and
Q196: The figure below shows the cost and
Q197: The following figure shows the marginal revenue
Unlock this Answer For Free Now!
View this answer and more for free by performing one of the following actions

Scan the QR code to install the App and get 2 free unlocks

Unlock quizzes for free by uploading documents