The following figure shows the revenue and cost curves of a monopolist.
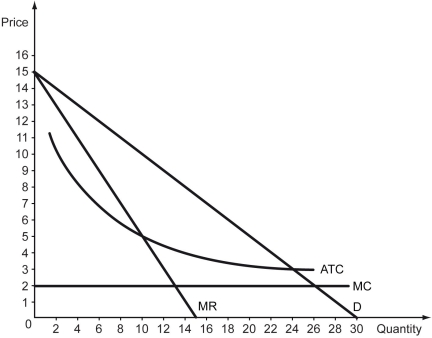
-Refer to the figure above.The output produced in this market is ________ units,while the output produced under a comparable perfectly competitive market is ________ units.
A) 15; 30
B) 10; 24
C) 13; 26
D) 10; 26
Correct Answer:
Verified
Q181: Which of the following statements is true
Q183: The following figure shows the graph of
Q184: The supply curve for a monopolist is
Q185: Does a monopolist have a supply curve?
Q187: Scenario: Suppose the monopolist faces the following
Q188: To maximize profits,the monopolist should charge a
Q189: At the profit-maximizing level of output and
Q190: A monopoly produces and sells 300 units
Q191: Which of the following statements is true?
A)
Q196: The figure below shows the cost and
Unlock this Answer For Free Now!
View this answer and more for free by performing one of the following actions

Scan the QR code to install the App and get 2 free unlocks

Unlock quizzes for free by uploading documents