The following figure shows the revenue and cost curves of a monopolist.
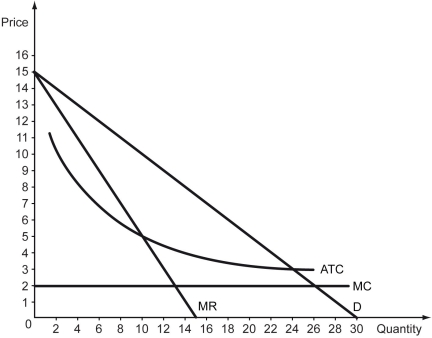
-Refer to the figure above.Compared to a competitive market,how much is the deadweight loss of this monopoly?
A) $64
B) $25
C) $144
D) $50
Correct Answer:
Verified
Q172: The figure below shows the cost and
Q195: The following figure shows the revenue and
Q196: The figure below shows the cost and
Q197: The following figure shows the marginal revenue
Q198: The following figure shows the marginal revenue
Q200: The following figure shows the marginal revenue
Q201: The following figure shows the market demand
Q202: The following figure shows the market demand
Q203: The following figure shows the market demand
Q204: The following figure shows the market demand
Unlock this Answer For Free Now!
View this answer and more for free by performing one of the following actions

Scan the QR code to install the App and get 2 free unlocks

Unlock quizzes for free by uploading documents