The following figure shows the costs and revenue curves of a firm in a monopoly market.
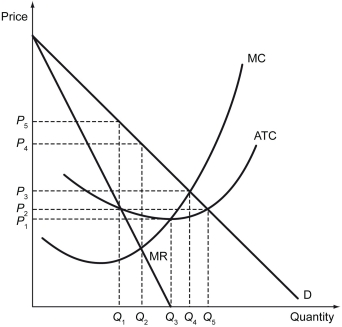
-Refer to the figure above.If the government decides to regulate this market at the socially optimal price level,it mandates the monopolist to sell its product at the price of ________.
A) $2
B) $5
C) $3
D) $10
Correct Answer:
Verified
Q279: Fair-returns pricing describes a situation in which
Q280: Differentiate between a socially optimal price and
Q281: The following figure shows the demand (D),
Q282: Encouraging the formation of monopolies provides firms
Q283: Scenario: Tobac Co. is a monopolist in
Q285: Which of the following firms is most
Q286: The following figure shows the demand (D),
Q287: The problem of superbugs,which are bacteria that
Q288: The example of decoding the human genome
Q289: The following figure shows the costs and
Unlock this Answer For Free Now!
View this answer and more for free by performing one of the following actions

Scan the QR code to install the App and get 2 free unlocks

Unlock quizzes for free by uploading documents