The following figure shows the cost curves (ATC, average total cost; MC, marginal cost) of a firm that operates in a monopolistic competition market, as well as the demand (D) facing the firm and the marginal revenue (MR) of this firm.
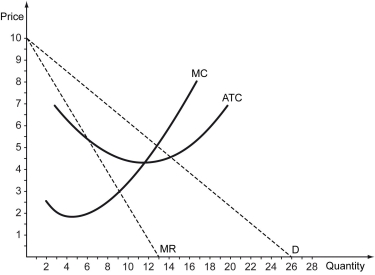
-Refer to the figure above.What is the profit-maximizing level of output that this firm should supply in the short run?
A) 9 units
B) 13 units
C) 6 units
D) 11 units
Correct Answer:
Verified
Q101: The following figure shows the cost curves
Q102: In the short run,a monopolistically competitive firm
Q103: The following figure shows the demand and
Q104: The table below summarizes the information possessed
Q105: The following table shows a firm's total
Q107: For a monopolistically competitive firm,_.
A) Marginal revenue
Q108: The marginal revenue curve of a monopolistic
Q109: The price charged by a monopolistic competitor
Q110: The table below summarizes the information possessed
Q111: A profit-maximizing monopolistic competitor continues production until
Unlock this Answer For Free Now!
View this answer and more for free by performing one of the following actions

Scan the QR code to install the App and get 2 free unlocks

Unlock quizzes for free by uploading documents